This PR adds all the guides from [Visual
Guides](https://bytebytego.com/guides/) section on bytebytego to the
repository with proper links.

- [x] Markdown files for guides and categories are placed inside
`data/guides` and `data/categories`
- [x] Guide links in readme are auto-generated using
`scripts/readme.ts`. Everytime you run the script `npm run
update-readme`, it reads the categories and guides from the above
mentioned folders, generate production links for guides and categories
and populate the table of content in the readme. This ensures that any
future guides and categories will automatically get added to the readme.
- [x] Sorting inside the readme matches the actual category and guides
sorting on production
1.8 KiB
title, description, image, createdAt, draft, categories, tags
| title | description | image | createdAt | draft | categories | tags | |||
|---|---|---|---|---|---|---|---|---|---|
| What is ELK Stack and Why is it Popular? | Learn about the ELK Stack: Elasticsearch, Logstash, and Kibana. | https://assets.bytebytego.com/diagrams/0183-elk.jpg | 2024-02-15 | false |
|
|
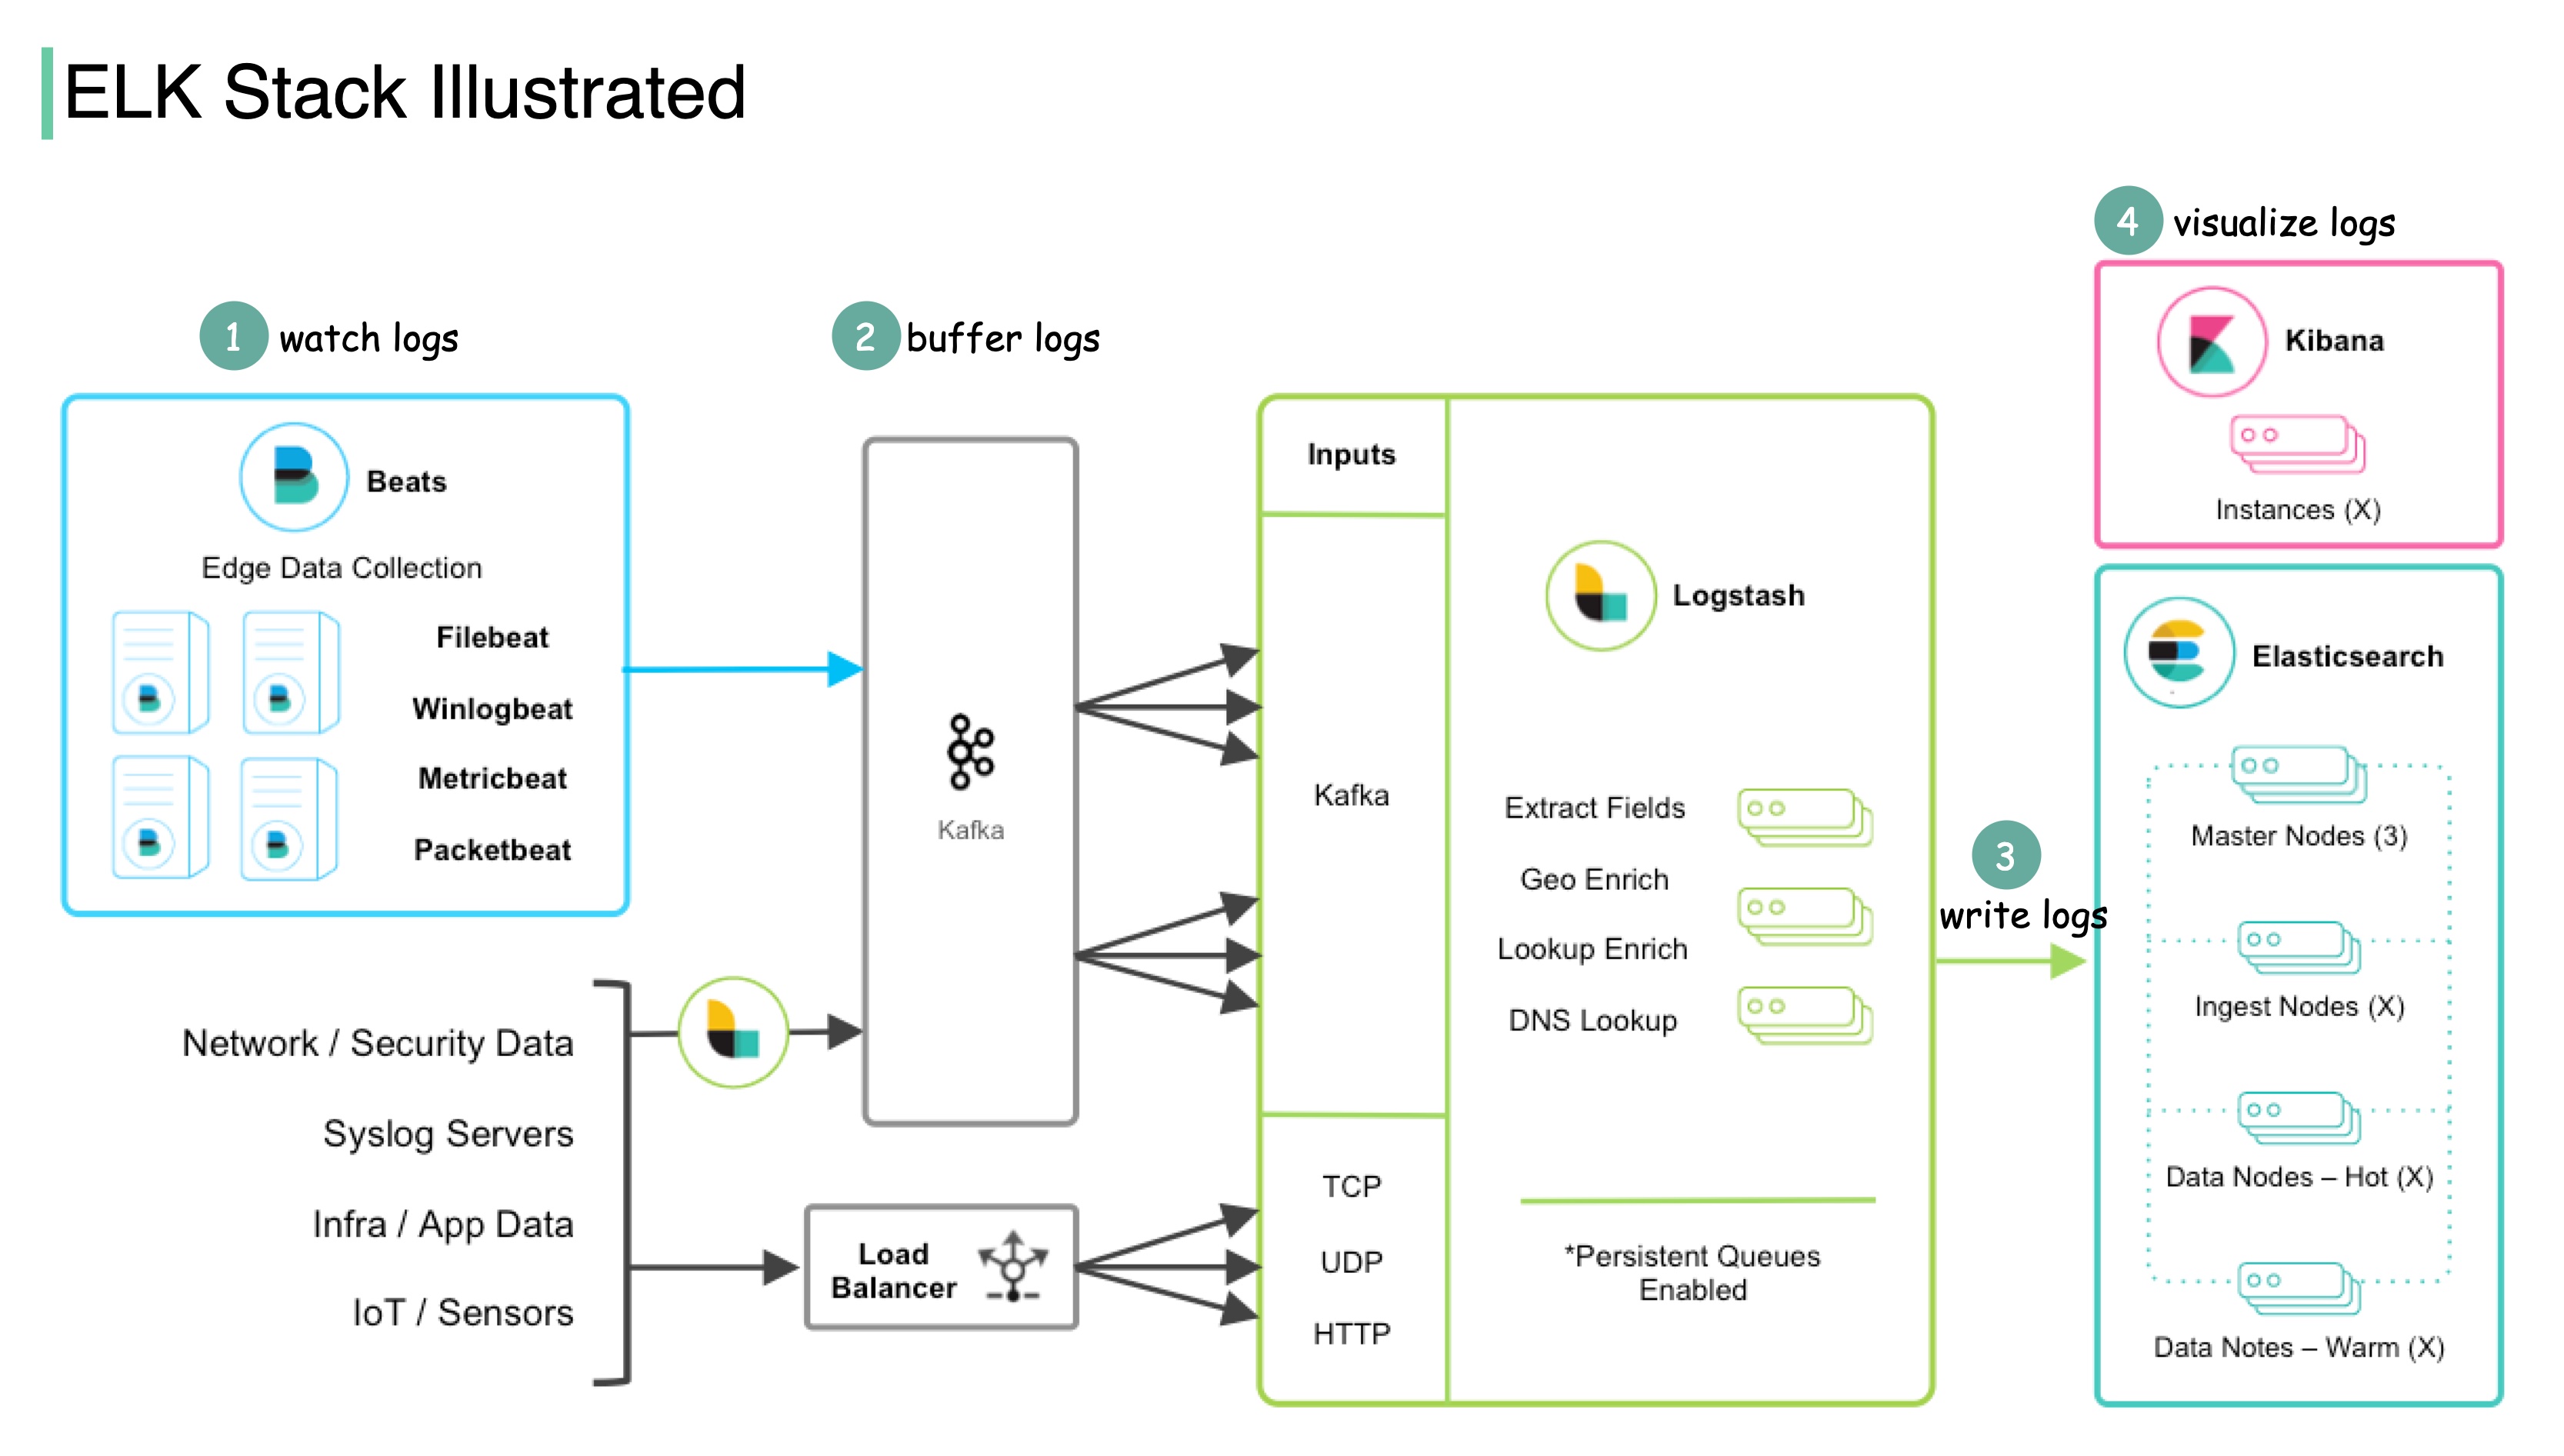
The ELK Stack is composed of three open-source products. ELK stands for Elasticsearch, Logstash, and Kibana.
-
Elasticsearch is a full-text search and analysis engine, leveraging Apache Lucene search engine as its core component.
-
Logstash collects data from all kinds of edge collectors, then transforms that data and sends it to various destinations for further processing or visualization.
In order to scale the edge data ingestion, a new product Beats is later developed as lightweight agents installed on edge hosts to collect and ship logs to Logstash.
- Kibana is a visualization layer with which users analyze and visualize the data.
The diagram above shows how ELK Stack works:
ELK Stack Workflow
Step 1 - Beats collects data from various data sources. For example, Filebeat and Winlogbeat work with logs, and Packetbeat works with network traffic.
Step 2 - Beats sends data to Logstash for aggregation and transformation. If we work with massive data, we can add a message queue (Kafka) to decouple the data producers and consumers.
Step 3 - Logstash writes data into Elasticsearch for data indexing and storage.
Step 4 - Kibana builds on top of Elasticsearch and provides users with various search tools and dashboards with which to visualize the data.
ELK Stack is pretty convenient for troubleshooting and monitoring. It became popular by providing a simple and robust suite in the log analytics space, for a reasonable price.