This PR adds all the guides from [Visual
Guides](https://bytebytego.com/guides/) section on bytebytego to the
repository with proper links.

- [x] Markdown files for guides and categories are placed inside
`data/guides` and `data/categories`
- [x] Guide links in readme are auto-generated using
`scripts/readme.ts`. Everytime you run the script `npm run
update-readme`, it reads the categories and guides from the above
mentioned folders, generate production links for guides and categories
and populate the table of content in the readme. This ensures that any
future guides and categories will automatically get added to the readme.
- [x] Sorting inside the readme matches the actual category and guides
sorting on production
1.7 KiB
title, description, image, createdAt, draft, categories, tags
| title | description | image | createdAt | draft | categories | tags | |||
|---|---|---|---|---|---|---|---|---|---|
| Logging, Tracing, and Metrics | Understand logging, tracing, and metrics for system observability. | https://assets.bytebytego.com/diagrams/0264-logging-tracing-metrics.png | 2024-03-11 | false |
|
|
Logging, tracing, and metrics are 3 pillars of system observability. The diagram below shows their definitions and typical architectures.
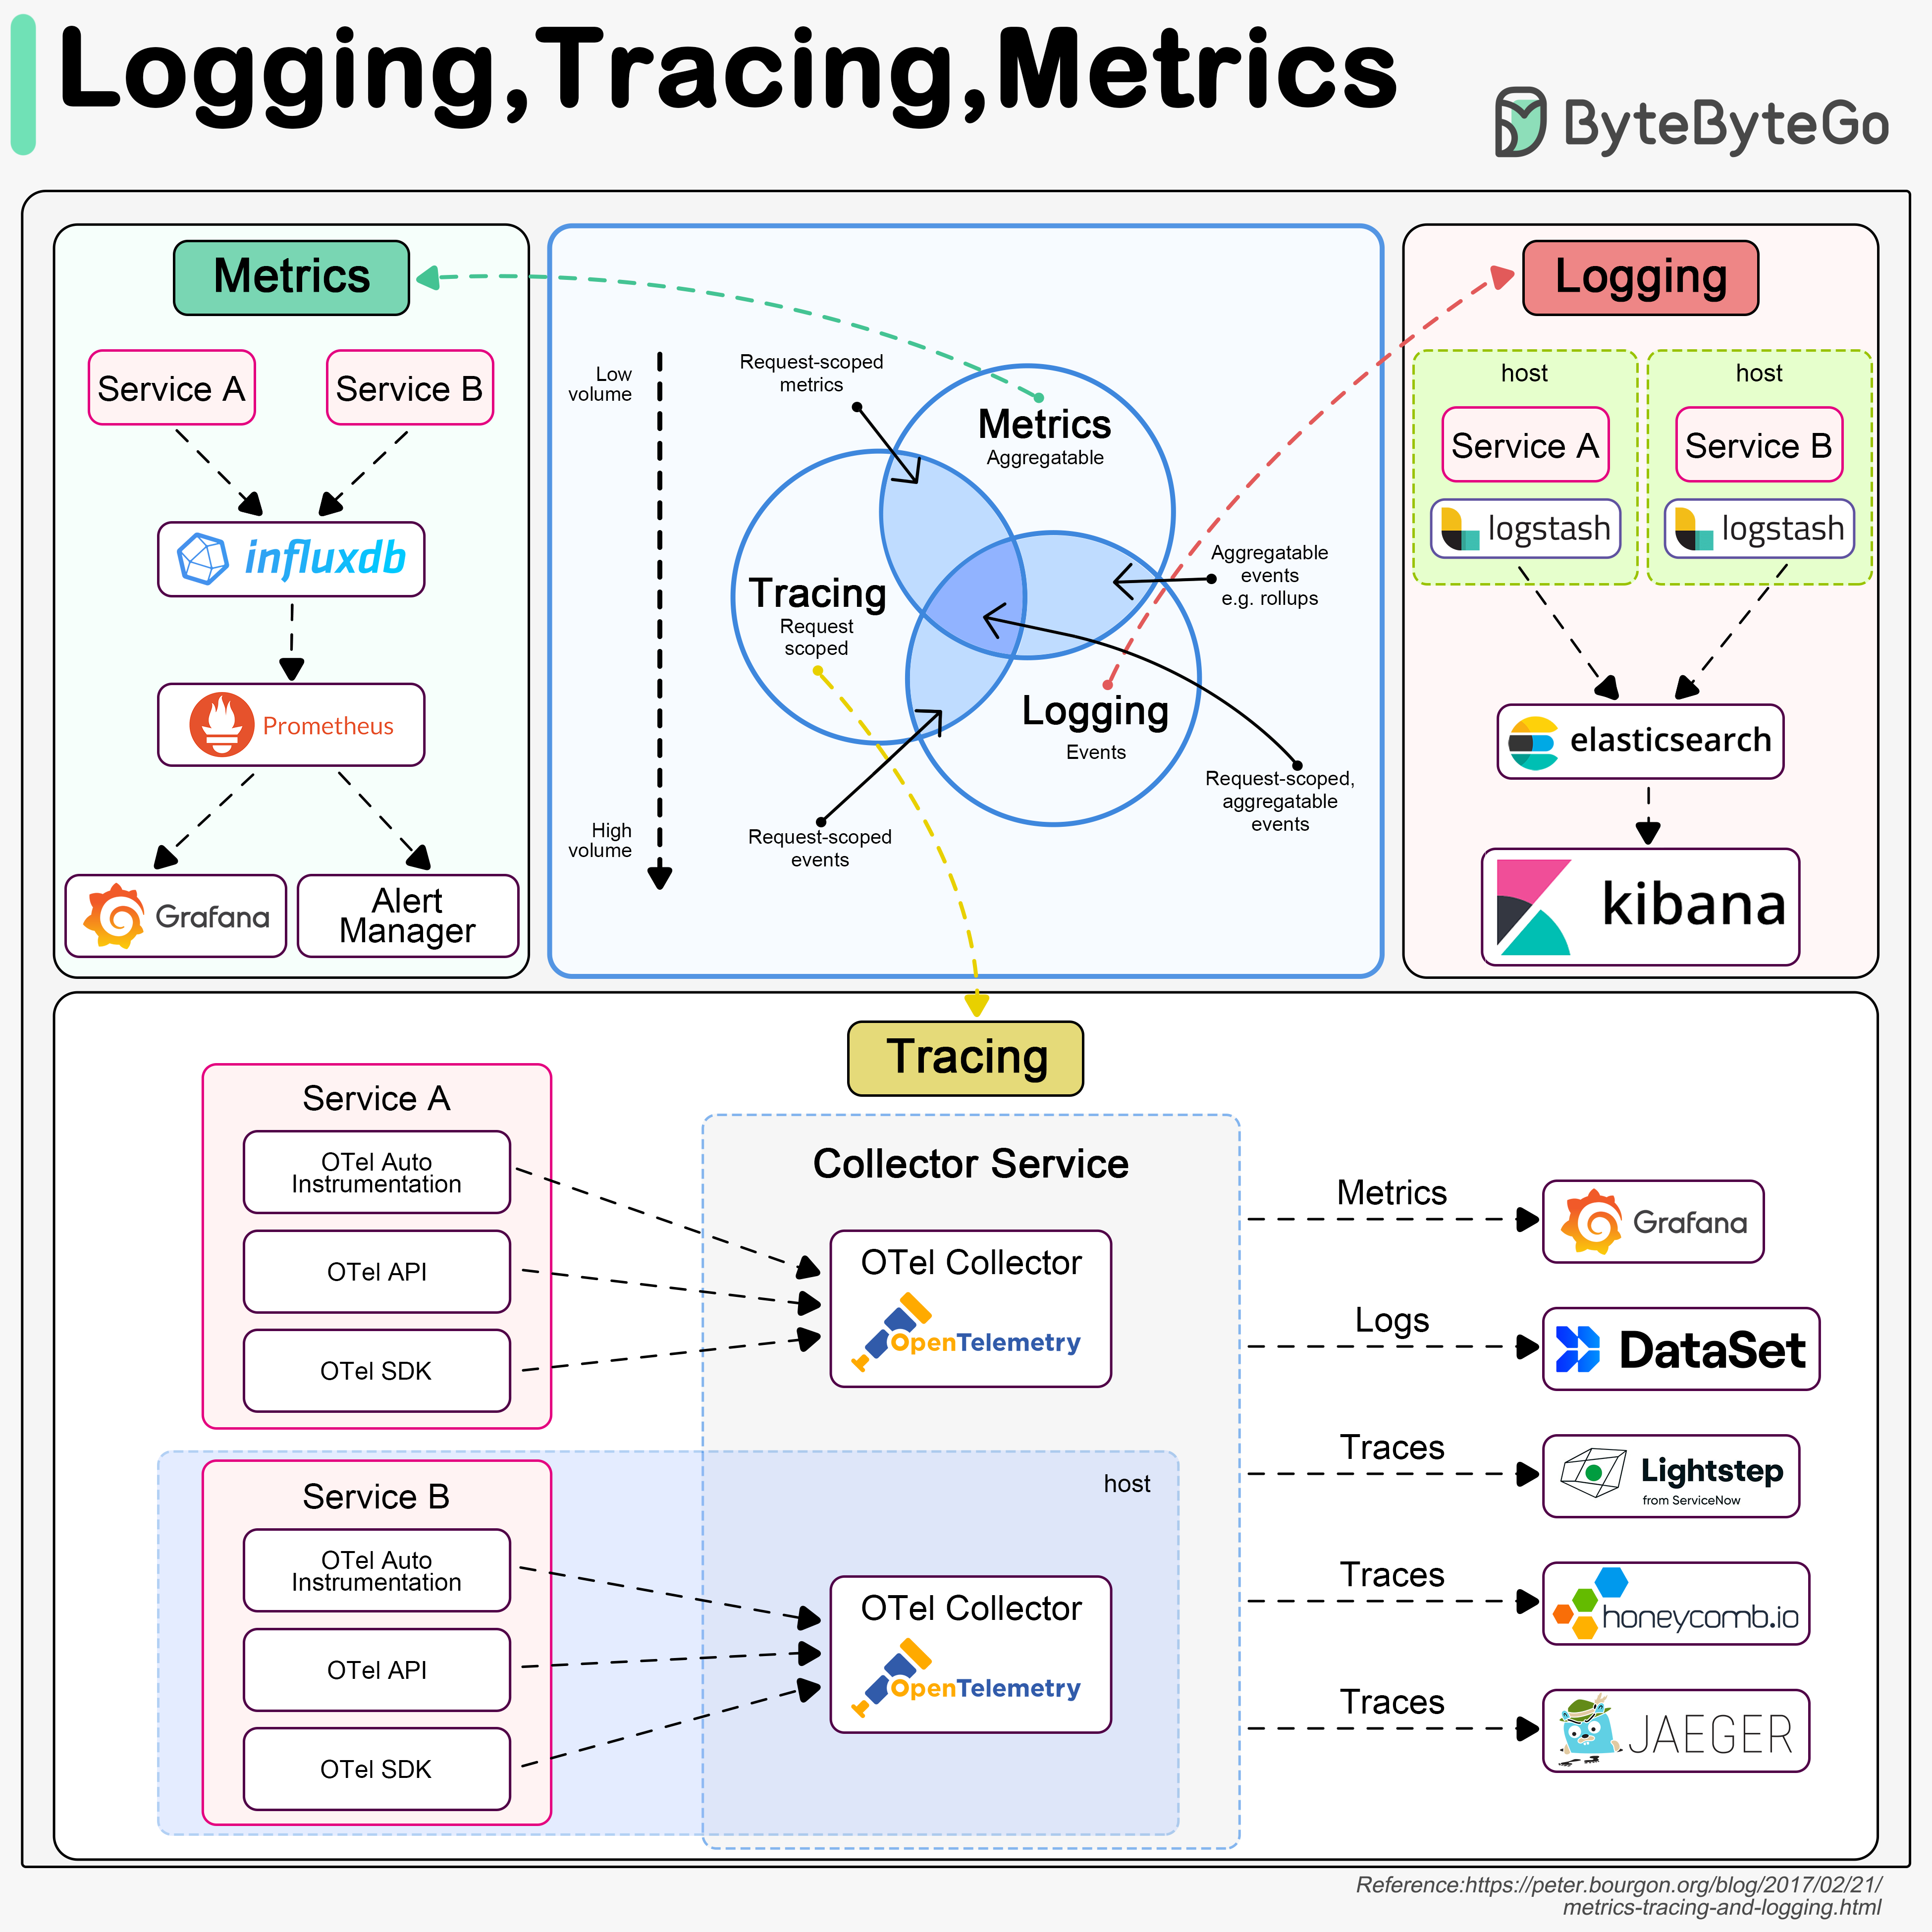
Logging
Logging records discrete events in the system. For example, we can record an incoming request or a visit to databases as events. It has the highest volume. ELK (Elastic-Logstash-Kibana) stack is often used to build a log analysis platform. We often define a standardized logging format for different teams to implement, so that we can leverage keywords when searching among massive amounts of logs.
Tracing
Tracing is usually request-scoped. For example, a user request goes through the API gateway, load balancer, service A, service B, and database, which can be visualized in the tracing systems. This is useful when we are trying to identify the bottlenecks in the system. We use OpenTelemetry to showcase the typical architecture, which unifies the 3 pillars in a single framework.
Metrics
Metrics are usually aggregatable information from the system. For example, service QPS, API responsiveness, service latency, etc. The raw data is recorded in time-series databases like InfluxDB. Prometheus pulls the data and transforms the data based on pre-defined alerting rules. Then the data is sent to Grafana for display or to the alert manager which then sends out email, SMS, or Slack notifications or alerts.